
Accuracy is where the ball lands, net clearance is how high it crosses, speed is how fast it leaves your strings, and consistency is how many times you can repeat all three. These four describe ball flight, which is one of four families of tennis metrics and the family that responds fastest to technical work. They have to be read together. Pushing any one of them higher costs you at least one of the others, and all four shift once you're tired, so a single number in isolation describes your session about as well as one frame describes a rally.
The Four Families of Tennis Metrics
"Tennis metrics" covers four groups that answer different questions on different timescales. Most confusion about training data comes from treating a number in one family as evidence about another.
|
Family |
Answers |
Examples |
How fast it moves |
|
Ball flight |
How good was that shot? |
Accuracy, net clearance, speed, spin, depth |
Weeks |
|
Repeatability |
Can you do it again under pressure? |
Balls in a row, in-rate at fixed pace, error type |
Weeks to months |
|
Physical load |
What did the session cost you? |
RPE, session load, stroke counts, distance, work-to-rest ratio |
Daily |
|
Outcome and level |
Did any of it work? |
Service games won, break point conversion, NTRP, UTR, World Tennis Number |
Seasons |
The layers lag each other. A change in net clearance shows up within two weeks; a change in your rating can take a year, because ratings are computed from match results, and match results depend on your opponents as much as on you. Judging a technical change by whether your rating moved is measuring the wrong layer.
Accuracy: Where the Ball Lands
Accuracy measures how close the ball lands to a target you chose before you hit it. That's a stricter standard than "in the court," which is why in/out percentage alone is a weak metric. A player who lands every ball three feet inside the service line has a perfect in-rate and a serious problem.
Two dimensions sit underneath it and behave differently:
- Depth is distance from the net along the length of the court. It decides whether your opponent hits from a comfortable position or a retreating one, and it's the first thing recreational players lose when they get tight.
- Width is distance from the center line toward the sideline. Width creates angle, but it also shortens the court and opens the corner you just left.
Track accuracy as a distribution rather than a score. A ball placement distribution shows the shape of your misses, and the shape identifies the cause: a cluster that's short and centered usually points to swing speed or clearance, while misses that scatter wide point to contact timing. One accuracy percentage hides both.
The cheapest version of target accuracy needs no technology. Put four towels down, hit a set number of balls, and count. The number matters less than counting the same way you counted last week.
Net Clearance: How High the Ball Crosses
Net clearance is the vertical distance between the ball and the top of the net as it passes over, usually reported in feet or centimeters. It gets the least attention at club level, and it works as the hidden variable behind two other numbers. Clearance sets your margin, since a ball passing a foot over the net has almost no room for slightly mistimed contact, while one passing several feet over absorbs the same error and still lands in. It also sets depth, because for a given pace and spin a higher trajectory lands deeper. That's why raising clearance is the standard fix for a player whose balls keep landing short. Short balls are more often a trajectory problem than a power problem.
You can measure clearance without a tracking system. Run a rope or a strip of tape across the court at a fixed height above the net band, hit a set of balls, and count how many pass under it. That gives you a repeatable reference to work against.

Speed and Spin: How Fast It Leaves and How Much It Rotates
Ball speed measures how fast the ball travels immediately after contact, reported in miles per hour in the US. Spin measures the ball's rotation, and this is where units cause real problems. Broadcast and tour data report revolutions per minute. Some training equipment is specified in revolutions per second, where 60 rev/s equals 3,600 RPM. Wearable sensors add a third meaning entirely: Catapult's tennis parameters report a mean rotation magnitude per stroke in revolutions per second, but that figure comes from an inertial sensor reading the player's own movement, not from anything measured on the ball. Three numbers, three referents, no valid comparison between them.
Speed is the most over-tracked of the four because it's the easiest to measure and the one that improves most visibly. It also means the least in isolation. A fast ball that lands short gives your opponent an easier ball to handle than a slow one that lands deep.
Spin is what makes pace safe. Topspin makes the ball drop faster than gravity alone would, so a heavily spun ball can be struck harder and sent higher over the net and still land in. That mechanism is the foundation of the modern baseline game, and it's why ball speed and spin have to be read together rather than one at a time.
Spin also produces the variable that almost nobody measures at club level: what the ball does after the bounce. Two balls can land on the same spot at the same speed and arrive at the opponent completely differently, one sitting up at waist height and one kicking above the shoulder. Bounce angle and height at the opponent's contact point are what make a ball feel heavy, and they're the reason spin is worth tracking even when its own number looks unimpressive.
Consistency: How Many Times You Can Repeat the Other Three
Consistency measures repeatability, not rally length. A twenty-ball rally of defensive floaters and a twenty-ball rally of deep crosscourt drives produce the same count and describe completely different players.
Measure it against a standard, not as a raw total. Useful versions:
- Balls in a row landing past the service line before one misses.
- In-rate across a fixed number of balls at a fixed pace, so the denominator doesn't move.
- The spread between your best five balls and your worst five in the same set. A narrow spread is consistency; a high average with a wide spread is variance wearing a disguise.
One condition moves this number more than anything about your stroke: how much time you get between balls. Consistency measured off a slow feed and consistency measured at match tempo are different metrics, which is why the choice between a fixed feed interval and recovery-based feeding has to stay constant across sessions for the numbers to compare.
How the Four Trade Off Against Each Other
You can't maximize all four at once. For a given racket-head speed you're allocating one budget between pace and spin. Spend it on pace and the ball flies flatter, which forces lower clearance to keep it in, which shrinks margin and costs consistency. Spend it on spin and you can raise clearance and hold depth, but the ball arrives slower.
|
If you increase |
What usually improves |
What usually degrades |
The adjustment |
|
Ball speed |
Pressure on your opponent |
Accuracy, consistency |
Add spin so the ball still drops in |
|
Net clearance |
Consistency, depth |
Time your opponent gets to prepare |
Add pace or spin to keep the ball penetrating |
|
Topspin |
Margin, depth control, bounce height |
Raw pace, penetration on slow courts |
Accept it as a trade, not a flaw |
|
Target precision |
Court positioning |
Consistency, at first |
Widen the target until the in-rate recovers |
Any single metric can be pushed to an impressive number by sacrificing the other three, which is what happens when a player tracks only one.
Professional match analysis handles this by aggregating rather than ranking. Shot Quality, a composite score used on tour, combines speed, spin, depth, width, and bounce angle into one number per shot instead of reporting them as competing statistics. You can't build that model at home. The transferable part is its logic: judge a change by whether the combination improved.
This is also why coaches commonly teach rally balls struck well below maximum. Around two-thirds effort is where accuracy, clearance, and consistency hold together while the ball still causes problems.
The Metrics These Four Don't Cover
Ball flight describes shots. What the session cost you and whether your game is improving are separate measurement problems with separate tools.
Physical Load: What the Session Cost You
Load metrics exist to manage fatigue and recovery, not technique. The simplest is RPE, a 1 to 10 rating of how hard a session felt, recorded after the session and multiplied by session length to give a rough weekly load. It needs no hardware, and a rating plus a duration is enough to catch the week that spiked.
Above that sit stroke counts and movement profiling. Wearable systems classify on-court movement into intensity bands and count strokes by type, then combine them into a session load figure. Catapult's tennis suite, for example, separates movement into running, dynamic, alert, low intensity, and passive, and splits strokes into serves, right-to-left, left-to-right, and other. The ATP's Physicality Index takes a similar approach for tour matches, reporting distance covered, workload, high-speed movement, and explosive power.
Composite load figures are usually reported in arbitrary units, so they compare only within the same system; a load number from one platform says nothing about a number from another.
Work-to-rest ratio is the load variable most relevant to recreational players and the easiest to control. Competitive tennis has been described in the research literature as running roughly one part work to three to five parts rest, so a session that runs continuously isn't reproducing match demands, whatever the stroke count says. That rhythm is one of the things a weekly training plan should be built around.
Outcome and Rating Metrics: Whether Any of It Worked
Match statistics and rating systems answer the question your training is ultimately for, and they answer it slowly.
On the match side, the numbers that carry the most information are efficiency measures rather than counts: percentage of service games won, break point conversion, break points saved, and performance at pressure scores such as 0-30 and 15-30, before a break point exists. Winners and unforced errors are the most quoted and the least reliable, because an unforced error is a judgment call made by a human statistician rather than a measurement, and the standard shifts between tournaments and between people.
On the level side, the US uses NTRP, a numeric scale topping out at 7.0 for touring professionals and built for league play. UTR rates players on a single scale calculated from match results regardless of age or gender, and World Tennis Number runs in the opposite direction, from 40 for a beginner down toward 1 for an elite professional. All three are outputs of match results, which makes them the slowest-moving numbers you have and the wrong instrument for evaluating a six-week technical block.
Published tour benchmarks in either category are worth reading for structure and worth ignoring as targets. They describe a population that serves, moves, and returns nothing like a club player, and they're computed from match volumes far beyond what a club player plays.

Fatigue Changes Every Number You Record
The same player produces different metrics at minute five and minute fifty of the same session. A review of tennis physiology in the British Journal of Sports Medicine reports hitting accuracy falling by as much as 81% as players approach volitional fatigue, while noting that the laboratory protocols used to induce that state are harsher than typical match play. The size of the effect is debatable. The direction isn't.
The practical consequence is about comparison. If you record numbers whenever you happen to think of it, you're measuring your fatigue state as much as your technique. Pick a fixed point in the session, usually after the warm-up and before fatigue sets in, and measure there every time. Then take a second set late in a session on purpose. The gap between the two is its own metric, and for players who lose third sets it's often the most informative number they have.
Build a Baseline Instead of Chasing Published Numbers
There's no reliable public benchmark to aim at, and the obstacle is measurement. Speed and spin figures from tour coverage come from stadium camera arrays, numbers in equipment reviews come from high-speed video, and consumer sensors infer from the swing rather than from the ball. They disagree with each other, and none of them was measured under your conditions with your balls on your surface.
A baseline you build yourself is comparable to itself, which is all a metric has to be. The method is unglamorous:
- Pick one drill you'll repeat, with a fixed number of balls and a fixed feed pace.
- Run it at the same point in three separate sessions.
- Record all four metrics each time and take the middle value, not the best one.
- Re-measure at the end of a training block. One good day is not a new baseline.
Three disciplines keep the comparison honest. Keep the sample big enough that one bad set can't move the median, since a metric from twenty balls is mostly noise. Split by surface, because a slower court changes bounce and effective pace enough to invalidate the comparison; baselining on two surfaces means carrying the same setup to each, which is a practical argument for a portable tennis ball machine over the heaviest model you can afford. And keep the balls consistent, since worn practice balls fly differently from fresh ones, and a baseline set with new balls will read as a decline the moment you switch to the bag that's been in your trunk since spring.
A structured multi-week plan gives the numbers enough time to move, and it's part of why match results alone tell you so little about whether your training is working.
How to Measure These Without a Lab
Start with what costs nothing, because the counting method matters more than the instrument.
One condition sits above the choice of tool: the input has to repeat. Practice metrics compare across sessions only if the ball arrives the same way each time, which a hand feed can't hold to and a tennis ball machine holds far more closely. The best tennis ball machine for measurement is the one with the most repeatable feed rather than the largest hopper, and feed consistency is one of the things a tested comparison of machines actually separates.
Targets and a rope. Towels or cones for accuracy, tape above the net for clearance, a counted set of balls for consistency. That covers three of the four metrics and it's the version you'll actually repeat.
Phone video. A camera on a fence post behind the baseline gives you clearance and depth by eye, plus a record you can compare month to month. It won't give you speed.
RPE and a notebook. The entire load family starts here. A session rating and a duration, written down, beats an unused wearable.
Radar and racket sensors. A pocket radar reads ball speed; a racket-mounted sensor estimates swing speed and stroke rotation. Both are single-purpose tools, both need identical setup every time, and what a racket sensor calls spin is calculated from your swing rather than measured on the ball.
Camera and tracking systems. A tennis ball tracking system resolves ball flight from video and reports several metrics at once. On-court vision of this kind is also what separates a tennis robot from a plain feeder. This is where tennis performance analytics stops being manual counting and starts producing a session record you can review afterward.
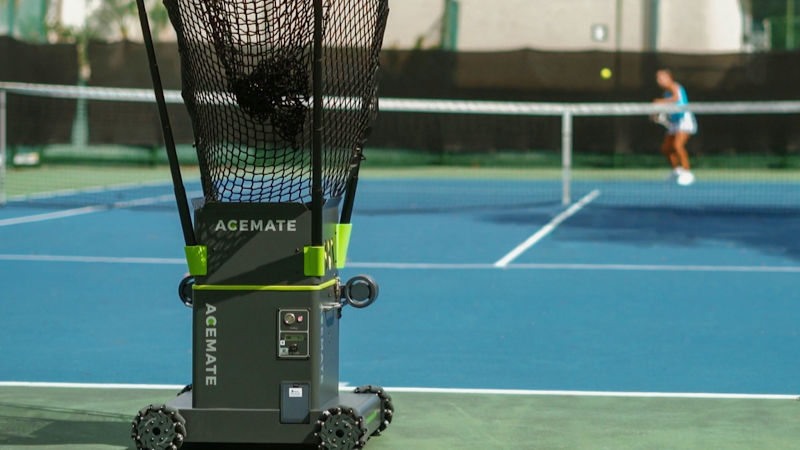
Some training equipment folds the tracking into the practice itself, which is the approach Acemate takes. The S10 records shot speed, net clearance height, landing point, and whether the ball landed in or out, and its session summary reports total shots, average and maximum speed, average net clearance, in/out rate, and a shot distribution map of where your returns landed. That gives you accuracy, clearance, and speed directly, plus an in-rate to track consistency against. It doesn't report spin in the session summary, which is worth confirming about any system before you assume one covers all four.
The Acemate S10 Pro extends that measurement approach further by tracking spin alongside shot speed, landing position, in/out rate, net clearance, and other session data. Its AI Coach can then use those records to identify performance gaps and suggest what to work on next. For players trying to turn raw tennis metrics into a repeatable training plan, that closes an important gap between measuring a shot and deciding how to train the next one.
Which Metric to Work On First
Work on the metric currently costing you the most points. As a starting order:
|
Level |
First priority |
What to measure |
Why this one |
|
New to competitive play |
Net clearance |
Balls passing above a tape line |
Most errors at this stage go into the net, and clearance fixes them faster than technique work |
|
Rallying comfortably, losing to steadier players |
Consistency |
Balls in a row past the service line |
Points are being lost on your errors, not won by your opponent |
|
Steady but getting pushed back |
Accuracy, depth first |
Percentage landing in the back third |
Short balls are the reason you're defending |
|
Solid depth, looking for pressure |
Speed and spin together |
Pace with in-rate held constant |
Adding pace alone moves your error count, not your win rate |
Add a metric only once the previous one holds steady under pressure. Chasing all four at once produces four mediocre numbers, and it's the most common way a player with good data gets worse. The same order shows up in drills grouped by NTRP level, where the early ones constrain trajectory and repetition and the later ones open up pace.
FAQ
Do these metrics work the same way for the serve?
No. Serve speed is the one number worth tracking directly, while net clearance means little on a serve, since the ball is supposed to pass close to the net. Track placement by service box quadrant and first-serve percentage instead.
Are ball machine numbers comparable to match numbers?
No. A machine feed arrives at a known time, place, and pace, so accuracy and consistency off a machine read better than they do in a rally. Track the two separately and compare each against itself.
Do these metrics apply to doubles?
Partly. Speed and consistency carry over, but accuracy targets change completely, since doubles rewards angle and low crosscourt trajectories over depth, and high net clearance mostly feeds the opposing net player a volley.
Is it worth tracking spin if your system doesn't measure it?
Yes, indirectly. If your net clearance rises and depth holds at the same pace, you added spin. That relationship gives a usable read on spin without a number, which is how coaches judged it before tracking existed.
Should you still log RPE if you wear a heart rate monitor?
Yes. Heart rate misses the mechanical cost of serving and hitting, which is much of what makes tennis fatiguing, and it drifts with heat and hydration. RPE captures what the session felt like, and the two disagreeing is itself a signal worth noticing.
